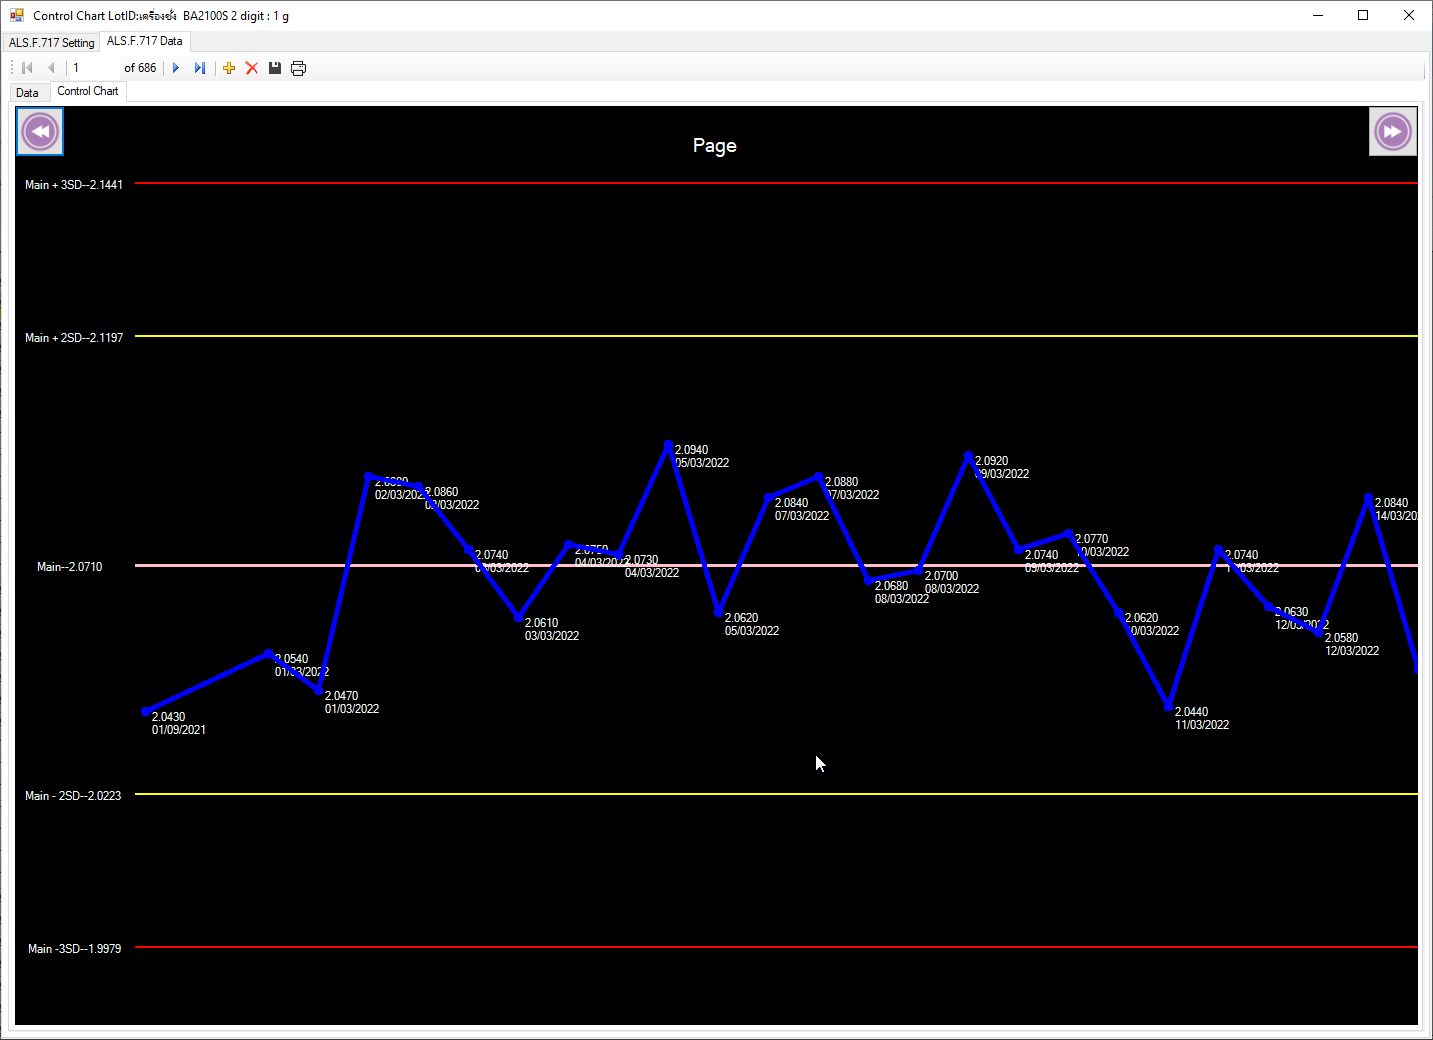
จากรูป เป็น รูปแบบ controlchart ครับ
โดยผมอยากรับข้อมูลมาชุดหนึ่ง จากนั้น สร้างกราฟ แยกในแต่ละหน้า
เลื่อนหน้าโดยการ กดปุ่ม ซ้ายขวา ด้านบน ครับ
ตอนนี้ ติด ปัญหา ดังนี้ครับ
1. ผมจะแยก แต่ละหน้าได้อย่างไร เริ่มต้น ผมคิดไว้ว่าจะแยก ทีละ 30 ข้อมูล ก่อน โดยความห่างของข้อมูลในแกนนอน เป็น 50
[Spoil] คลิกเพื่อดูข้อความที่ซ่อนไว้ int SizeColumn = 50;
แต่คิดไม่ออก ว่า จะแยกเป้นหน้าๆ ยังไง เพราะ
2. ถ้ามีการ ย่อขยายความห่างของข้อมูลในแกนนอน ยังเป็น 50 อยู่ แสดงว่า จำนวนข้อมูลแต่ละหน้า ก็ต้องเปลี่ยนไป
โค้ดครับ
[Spoil] คลิกเพื่อดูข้อความที่ซ่อนไว้using System;
using System.Collections.Generic;
using System.ComponentModel;
using System.Drawing;
using System.Data;
using System.Linq;
using System.Text;
using System.Windows.Forms;
using TORServices.DB.PrintDB;
namespace TORServices.Forms
{
public partial class controlChart : UserControl
{
/// <summary>
/// Required designer variable.
/// </summary>
private System.ComponentModel.IContainer components = null;
/// <summary>
/// Clean up any resources being used.
/// </summary>
/// <param name="disposing">true if managed resources should be disposed; otherwise, false.</param>
protected override void Dispose(bool disposing)
{
if (disposing && (components != null))
{
components.Dispose();
}
base.Dispose(disposing);
}
#region Component Designer generated code
/// <summary>
/// Required method for Designer support - do not modify
/// the contents of this method with the code editor.
/// </summary>
private void InitializeComponent()
{
this.panel1 = new System.Windows.Forms.Panel();
this.btnNext = new System.Windows.Forms.Button();
this.btnPrevious = new System.Windows.Forms.Button();
this.lblPage = new System.Windows.Forms.Label();
this.panel1.SuspendLayout();
this.SuspendLayout();
//
// panel1
//
this.panel1.Controls.Add(this.lblPage);
this.panel1.Controls.Add(this.btnNext);
this.panel1.Controls.Add(this.btnPrevious);
this.panel1.Dock = System.Windows.Forms.DockStyle.Top;
this.panel1.Location = new System.Drawing.Point(0, 0);
this.panel1.Name = "panel1";
this.panel1.Size = new System.Drawing.Size(1010, 51);
this.panel1.TabIndex = 0;
//
// btnNext
//
this.btnNext.BackgroundImage = global::TORServices.Forms.Properties.Resources.arrow_next_right;
this.btnNext.BackgroundImageLayout = System.Windows.Forms.ImageLayout.Zoom;
this.btnNext.Dock = System.Windows.Forms.DockStyle.Right;
this.btnNext.Location = new System.Drawing.Point(960, 0);
this.btnNext.Name = "btnNext";
this.btnNext.Size = new System.Drawing.Size(50, 51);
this.btnNext.TabIndex = 2;
this.btnNext.UseVisualStyleBackColor = true;
this.btnNext.Click += new System.EventHandler(this.btnNext_Click);
//
// btnPrevious
//
this.btnPrevious.BackgroundImage = global::TORServices.Forms.Properties.Resources.arrow_left_previous;
this.btnPrevious.BackgroundImageLayout = System.Windows.Forms.ImageLayout.Zoom;
this.btnPrevious.Dock = System.Windows.Forms.DockStyle.Left;
this.btnPrevious.Location = new System.Drawing.Point(0, 0);
this.btnPrevious.Name = "btnPrevious";
this.btnPrevious.Size = new System.Drawing.Size(50, 51);
this.btnPrevious.TabIndex = 0;
this.btnPrevious.UseVisualStyleBackColor = true;
this.btnPrevious.Click += new System.EventHandler(this.btnPrevious_Click);
//
// lblPage
//
this.lblPage.Dock = System.Windows.Forms.DockStyle.Bottom;
this.lblPage.Font = new System.Drawing.Font("Microsoft Sans Serif", 14.25F, System.Drawing.FontStyle.Regular, System.Drawing.GraphicsUnit.Point, ((byte)(0)));
this.lblPage.ForeColor = System.Drawing.Color.White;
this.lblPage.Location = new System.Drawing.Point(50, 27);
this.lblPage.Name = "lblPage";
this.lblPage.Size = new System.Drawing.Size(910, 24);
this.lblPage.TabIndex = 3;
this.lblPage.Text = "Page";
this.lblPage.TextAlign = System.Drawing.ContentAlignment.MiddleCenter;
//
// controlChart
//
this.AutoScaleDimensions = new System.Drawing.SizeF(6F, 13F);
this.AutoScaleMode = System.Windows.Forms.AutoScaleMode.Font;
this.BackColor = System.Drawing.Color.Black;
this.Controls.Add(this.panel1);
this.Name = "controlChart";
this.Size = new System.Drawing.Size(1010, 551);
this.Resize += new System.EventHandler(this.controlChart_Resize);
this.panel1.ResumeLayout(false);
this.ResumeLayout(false);
}
#endregion
public controlChart()
{
InitializeComponent();
}
public double ValueMean, ValueSD;
public int Decimal = 4;
private Panel panel1;
private Button btnNext;
private Button btnPrevious;
public List<DataControlChart> Datas;
int contPerPage = 30;
int page = 1;
int Allpage = 1;
private Label lblPage;
int item = 0;
int startItem = 0;
int SizeColumn = 50;
public void RefreshChart(int pg = 1)
{
if (Datas == null || Datas.Count < 1) return;
// Set value
double vUp3SD = ValueMean + (3 * ValueSD);
double vUp2SD = ValueMean + (2 * ValueSD);
double vDwn2SD = ValueMean - (2 * ValueSD);
double vDwn3SD = ValueMean - (3 * ValueSD);
int lntMain = Convert.ToInt32(this.Height / 2);
int lntUp3SD = lntMain - Convert.ToInt32(lntMain / 1.2);
int lntUp2SD = lntMain - Convert.ToInt32(lntMain / 2);
int lntDwn2SD = lntMain + Convert.ToInt32(lntMain / 2);
int lntDwn3SD = lntMain + Convert.ToInt32(lntMain / 1.2);
double ddd = (lntDwn3SD - lntUp3SD) / (vUp3SD - vDwn3SD);
Bitmap b = new Bitmap(this.Width, this.Height);
int _x1 = 120;
btnNext.Visible = false;
btnPrevious.Visible = false;
using (Graphics g = Graphics.FromImage(b))
{
g.Clear(Color.Black);
g.FillRectangle(Brushes.Black, new Rectangle(0, 0, b.Width, b.Height));
System.Drawing.Pen p;
g.DrawString(" Main--" + ValueMean.ToString("N" + Decimal), this.Font, Brushes.Azure, 5, lntMain - 5);
g.DrawString(" Main - 2SD--" + vDwn2SD.ToString("N" + Decimal), this.Font, Brushes.Azure, 5, lntDwn2SD - 5);
g.DrawString(" Main + 2SD--" + vUp2SD.ToString("N" + Decimal), this.Font, Brushes.Azure, 5, lntUp2SD - 5);
g.DrawString(" Main -3SD--" + vDwn3SD.ToString("N" + Decimal), this.Font, Brushes.Azure, 5, lntDwn3SD - 5);
g.DrawString(" Main + 3SD--" + vUp3SD.ToString("N" + Decimal), this.Font, Brushes.Azure, 5, lntUp3SD - 5);
g.DrawLine(new System.Drawing.Pen(Brushes.Pink, 3), _x1, lntMain, b.Width, lntMain);
g.DrawLine(new System.Drawing.Pen(Brushes.Yellow, 2), _x1, lntDwn2SD, b.Width, lntDwn2SD);
g.DrawLine(new System.Drawing.Pen(Brushes.Yellow, 2), _x1, lntUp2SD, b.Width, lntUp2SD);
g.DrawLine(new System.Drawing.Pen(Brushes.Red, 2), _x1, lntDwn3SD, b.Width, lntDwn3SD);
g.DrawLine(new System.Drawing.Pen(Brushes.Red, 2), _x1, lntUp3SD, b.Width, lntUp3SD);
int x1 = _x1 + 10;
int y1 = 0;
int x2 = 0;
int y2 = 0;
x2 = x1 + SizeColumn + Convert.ToInt32(SizeColumn / 2.2);
y1 = (int)((ddd * (vUp3SD - (double)Datas[0]._value)) + lntUp3SD);
g.DrawString(((double)Datas[0]._value).ToString("N" + Decimal) + Environment.NewLine +
Datas[0]._date.ToString("dd/MM/yyyy"),
this.Font, Brushes.White, x1 + 5, y1);
y2 = 0;
p = new System.Drawing.Pen(Brushes.Blue, 5);
p.EndCap = System.Drawing.Drawing2D.LineCap.RoundAnchor;
p.StartCap = System.Drawing.Drawing2D.LineCap.RoundAnchor;
for (int i = 1; i <= contPerPage; i++)
{
if (i > 0) x2 = x2 + SizeColumn;
if (!string.IsNullOrEmpty("" + Datas[item]._value))
{
y2 = (int)((ddd * (vUp3SD - (double)Datas[item]._value)) + lntUp3SD);
g.DrawLine(p, x1, y1, x2, y2);
g.DrawString(((double)Datas[item]._value).ToString("N" + Decimal) + Environment.NewLine +
Datas[item]._date.ToString("dd/MM/yyyy"),
this.Font, Brushes.White, x2 + 5, y2);
x1 = x2;
y1 = y2;
}
item++;
if (item >= Datas.Count) break;
}
/* if(item < Datas.Count)
btnNext.Visible = true;
else
btnNext.Visible = false*/
btnNext.Visible = (item < Datas.Count) ;
btnPrevious.Visible = (item > contPerPage);
/* if (item > contPerPage)
{
btnPre

C# WinApp ขอสอบถามเรื่องฐานข้อมูล แบบนี้ หน่อยครับ
จากรูป เป็น รูปแบบ controlchart ครับ
โดยผมอยากรับข้อมูลมาชุดหนึ่ง จากนั้น สร้างกราฟ แยกในแต่ละหน้า
เลื่อนหน้าโดยการ กดปุ่ม ซ้ายขวา ด้านบน ครับ
ตอนนี้ ติด ปัญหา ดังนี้ครับ
1. ผมจะแยก แต่ละหน้าได้อย่างไร เริ่มต้น ผมคิดไว้ว่าจะแยก ทีละ 30 ข้อมูล ก่อน โดยความห่างของข้อมูลในแกนนอน เป็น 50
[Spoil] คลิกเพื่อดูข้อความที่ซ่อนไว้
แต่คิดไม่ออก ว่า จะแยกเป้นหน้าๆ ยังไง เพราะ
2. ถ้ามีการ ย่อขยายความห่างของข้อมูลในแกนนอน ยังเป็น 50 อยู่ แสดงว่า จำนวนข้อมูลแต่ละหน้า ก็ต้องเปลี่ยนไป
โค้ดครับ
[Spoil] คลิกเพื่อดูข้อความที่ซ่อนไว้