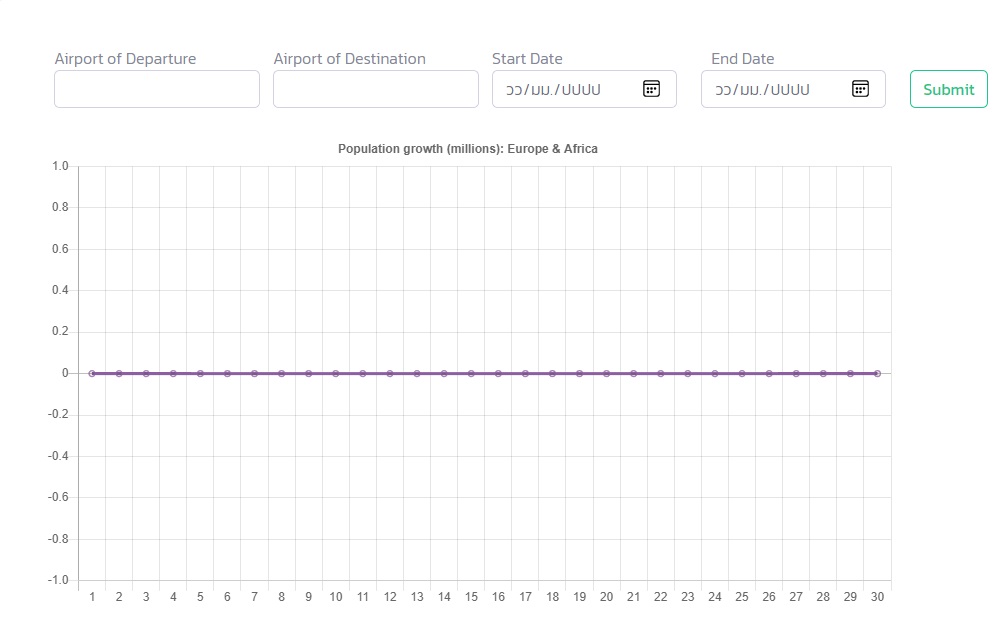
ทำ chart mixed ให้แสดงโชว์ข้อมูลออกมาเป็นกราฟ แต่ปัญหาตอนนี้เส้นกราฟไม่ขึ้น ต้องแก้ตรงไหนบ้างครับ
ขอบคุณครับ

ใส่โค้ด
<div class="col-md-8">
<canvas id="mixed-chart" width="800" height="450"></canvas>
<script src="https://cdnjs.cloudflare.com/ajax/libs/Chart.js/2.9.4/Chart.min.js"></script>
<div class="form-group">
<script>
new Chart(document.getElementById("mixed-chart"), {
type: 'bar',
data: {
labels: [
<?php
for ($i = 1; $i <= $lastDayThisMonth; $i++) {
if ($i > 1) {
echo ',';
}
echo "'" . $i . "'";
} ?>
],
datasets: [{
label: "total_prepaid",
type: "line",
borderColor: "#8e5ea2",
data: [
<?php
$k = [];
foreach ($day_total_prepaid_chart as $row) {
$k[($row->no_date * 1)] = $row->total_prepaid;
}
for ($j = 1; $j <= $lastDayThisMonth; $j++) {
if ($j > 1) {
echo ',';
}
echo (isset($k[$j])) ? "'" . $k[$j] . "'" : "'0'";
}
?>
],
fill: false
},/* {
label: "Africa",
type: "line",
borderColor: "#3e95cd",
data: [133, 221, 783, 2478],
fill: false
}, {
label: "Europe",
type: "bar",
backgroundColor: "rgba(0,0,0,0.2)",
data: [408, 547, 675, 734],
}, {
label: "Africa",
type: "bar",
backgroundColor: "rgba(0,0,0,0.2)",
backgroundColorHover: "#3e95cd",
data: [133, 221, 783, 2478]
}*/]
},
options: {
title: {
display: true,
text: 'Population growth (millions): Europe & Africa'
},
legend: {
display: false
}
}
});
</script>
ใส่โค้ด
public function get_dashboard_day_total_prepaid_chart()
{
$sql = "SELECT MONTHNAME(airwaybills.date) as month, sum(airwaybills.total_prepaid) as total_prepaid, DATE_FORMAT(airwaybills.date, '%d') as no_date,
date(airwaybills.date) as date, customers.shipper_name as cus_shipname, customers.consignee_name as cus_conname,airport_departures.short_name AS dep_name,
airport_destinations.short_name as des_name, airwaybills.pieces as air_pieces,
MONTHNAME(airwaybills.created_at) as namemonth from airwaybills
INNER JOIN airport_departures ON airwaybills.airport_departure_id = airport_departures.id
INNER JOIN airport_destinations ON airwaybills.airport_destination_id = airport_destinations.id
INNER JOIN customers ON airwaybills.customer_id = customers.id
WHERE airwaybills.customer_id = customers.id
GROUP BY MONTHNAME(airwaybills.date),date(airwaybills.date)";
// $query = $this->db->get();
$query = $this->db->query($sql);
//echo "<pre>";
// print_r($query->result());
// echo "</pre>";die();
return $query->result_array();
ใส่โค้ด
public function index()
{
$user = $this->ion_auth->user()->row();
$user_group = $this->users_group_model->find_userId($user->user_id);
// echo '<pre>',print_r($user_group,1),'</pre>';
if ($user_group->group_id == 1) {
$chargeable_weight_chart = $this->dashboard_model->get_dashboard_chargeable_weight_chart();
// $day_total_prepaid_chart = $this->dashboard_model->get_dashboard_day_total_prepaid_chart();
$total_prepaid_chart = $this->dashboard_model->get_dashboard_total_prepaid_chart();
$pieces_chart = $this->dashboard_model->get_dashboard_pieces_chart();
$total_chart = $this->dashboard_model->get_dashboard_total_chart();
/* $start_date = isset($_POST['start_date']) ? $_POST['start_date'] : "";
$end_date = isset($_POST['end_date']) ? $_POST['end_date'] : "";
$departure = isset($_POST['departure']) ? $_POST['departure'] : "";
$destination = isset($_POST['destination']) ? $_POST['destination'] : "";*/
$day_total_prepaid_chart = $this->dashboard_model->get_dashboard_day_total_prepaid_chart();
$lastDayThisMonth = date("t");
$this->data['day_total_prepaid_chart'] = $day_total_prepaid_chart;
$this->data['lastDayThisMonth'] = $lastDayThisMonth;
$this->data['chargeable_weight_chart'] = $chargeable_weight_chart;
$this->data['total_prepaid_chart'] = $total_prepaid_chart;
$this->data['pieces_chart'] = $pieces_chart;
$this->data['total_chart'] = $total_chart;
$this->data['view_name'] = 'dashboards/index';
} else
$this->data['view_name'] = 'dashboards/index_welcome';
$this->load->view('layouts/main', $this->data);
}
ทำ chart mixed ให้แสดงโชว์ข้อมูลออกมาเป็นกราฟ แต่มีปัญหาเส้นกราฟไม่ขึ้นครับ
ขอบคุณครับ
<div class="col-md-8">
<canvas id="mixed-chart" width="800" height="450"></canvas>
<script src="https://cdnjs.cloudflare.com/ajax/libs/Chart.js/2.9.4/Chart.min.js"></script>
<div class="form-group">
<script>
new Chart(document.getElementById("mixed-chart"), {
type: 'bar',
data: {
labels: [
<?php
for ($i = 1; $i <= $lastDayThisMonth; $i++) {
if ($i > 1) {
echo ',';
}
echo "'" . $i . "'";
} ?>
],
datasets: [{
label: "total_prepaid",
type: "line",
borderColor: "#8e5ea2",
data: [
<?php
$k = [];
foreach ($day_total_prepaid_chart as $row) {
$k[($row->no_date * 1)] = $row->total_prepaid;
}
for ($j = 1; $j <= $lastDayThisMonth; $j++) {
if ($j > 1) {
echo ',';
}
echo (isset($k[$j])) ? "'" . $k[$j] . "'" : "'0'";
}
?>
],
fill: false
},/* {
label: "Africa",
type: "line",
borderColor: "#3e95cd",
data: [133, 221, 783, 2478],
fill: false
}, {
label: "Europe",
type: "bar",
backgroundColor: "rgba(0,0,0,0.2)",
data: [408, 547, 675, 734],
}, {
label: "Africa",
type: "bar",
backgroundColor: "rgba(0,0,0,0.2)",
backgroundColorHover: "#3e95cd",
data: [133, 221, 783, 2478]
}*/]
},
options: {
title: {
display: true,
text: 'Population growth (millions): Europe & Africa'
},
legend: {
display: false
}
}
});
</script>
public function get_dashboard_day_total_prepaid_chart()
{
$sql = "SELECT MONTHNAME(airwaybills.date) as month, sum(airwaybills.total_prepaid) as total_prepaid, DATE_FORMAT(airwaybills.date, '%d') as no_date,
date(airwaybills.date) as date, customers.shipper_name as cus_shipname, customers.consignee_name as cus_conname,airport_departures.short_name AS dep_name,
airport_destinations.short_name as des_name, airwaybills.pieces as air_pieces,
MONTHNAME(airwaybills.created_at) as namemonth from airwaybills
INNER JOIN airport_departures ON airwaybills.airport_departure_id = airport_departures.id
INNER JOIN airport_destinations ON airwaybills.airport_destination_id = airport_destinations.id
INNER JOIN customers ON airwaybills.customer_id = customers.id
WHERE airwaybills.customer_id = customers.id
GROUP BY MONTHNAME(airwaybills.date),date(airwaybills.date)";
// $query = $this->db->get();
$query = $this->db->query($sql);
//echo "<pre>";
// print_r($query->result());
// echo "</pre>";die();
return $query->result_array();
public function index()
{
$user = $this->ion_auth->user()->row();
$user_group = $this->users_group_model->find_userId($user->user_id);
// echo '<pre>',print_r($user_group,1),'</pre>';
if ($user_group->group_id == 1) {
$chargeable_weight_chart = $this->dashboard_model->get_dashboard_chargeable_weight_chart();
// $day_total_prepaid_chart = $this->dashboard_model->get_dashboard_day_total_prepaid_chart();
$total_prepaid_chart = $this->dashboard_model->get_dashboard_total_prepaid_chart();
$pieces_chart = $this->dashboard_model->get_dashboard_pieces_chart();
$total_chart = $this->dashboard_model->get_dashboard_total_chart();
/* $start_date = isset($_POST['start_date']) ? $_POST['start_date'] : "";
$end_date = isset($_POST['end_date']) ? $_POST['end_date'] : "";
$departure = isset($_POST['departure']) ? $_POST['departure'] : "";
$destination = isset($_POST['destination']) ? $_POST['destination'] : "";*/
$day_total_prepaid_chart = $this->dashboard_model->get_dashboard_day_total_prepaid_chart();
$lastDayThisMonth = date("t");
$this->data['day_total_prepaid_chart'] = $day_total_prepaid_chart;
$this->data['lastDayThisMonth'] = $lastDayThisMonth;
$this->data['chargeable_weight_chart'] = $chargeable_weight_chart;
$this->data['total_prepaid_chart'] = $total_prepaid_chart;
$this->data['pieces_chart'] = $pieces_chart;
$this->data['total_chart'] = $total_chart;
$this->data['view_name'] = 'dashboards/index';
} else
$this->data['view_name'] = 'dashboards/index_welcome';
$this->load->view('layouts/main', $this->data);
}