USDCHF
Overview:
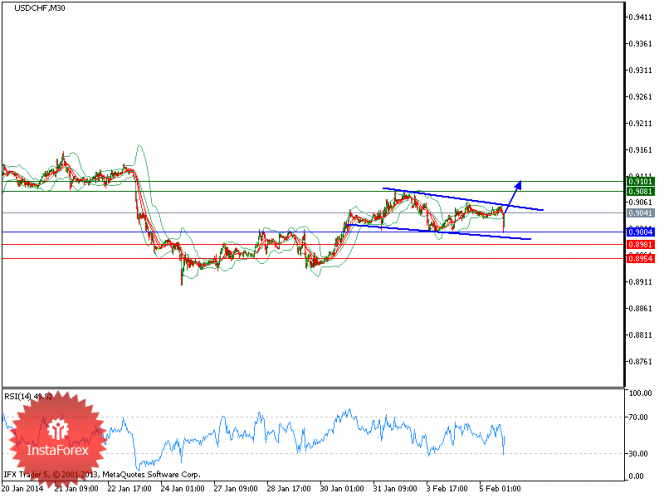
USD/CHF is expected to range-trade. It is and supported by the reduced safe-haven appeal of franc as risk aversion recedes. But USD/CHF upside is limited by the franc demand on buoyant CHF/JPY cross. Daily chart is mixed as stochastics is neutral, MACD is in bearish mode, inside-day-range pattern was completed on Tuesday.
Trading recommendation:
The pair is trading above its pivot point. It is likely to trade in a higher range as far as it remains above its pivot point. As far as the price is above its pivot point, a long position is recommended with the first target at 0.908 and the second target at 0.91. In an alternative scenario, if the price moves below its pivot points, short positions are recommended with the first target at 0.898. A breach of this target will push the pair further downwards and one may expect the second target at 0.8955. The pivot point is at 0.9015.
Resistance levels:
0.908
0.91
0.912
Support levels:
0.898
0.8955
0.8925
GBP/JPY
Overview:
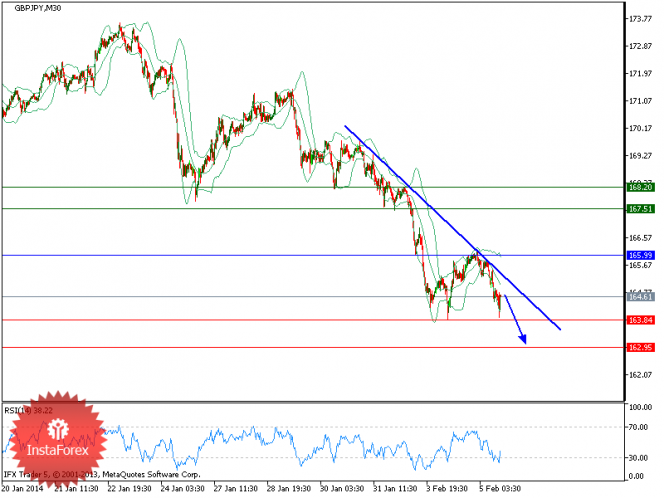
GBP/JPY is expected to trade in lower range. It is underpinned by reduced investor risk aversion and demand from Japan importers. But GBP/JPY gains are tempered by the Japan exporter sales. Daily chart is still negative-biased as MACD is bearish; stochastics stays suppressed at oversold zone, 5 and 15-day moving averages are declining.
Trading recommendation:
The pair is trading below its pivot point. It is likely to trade in a lower range as far as it remains below its pivot point. Short position is recommended with the first target at 163.85 in mind. A breach of this target will move the pair further downwards to 162.95. The pivot point stands at 166.9. In case the price moves in the opposite direction, bounces back from support, and then moves above its pivot point, it is most favourably expected to move further to the upside. In that scenario, a long position is recommended with the first target at 168.2 and the second target at 169.7.
Resistance levels:
167.5
168.2
168.9
Support levels:
163.85
162.95
162
GBP/USD
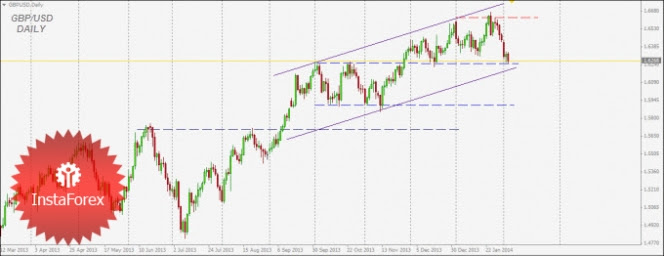
The GBP/USD pair failed to fixate above 1.6600 on January 24. Instead, a strong bearish impulse initiated quickly pushing the pair towards 1.6250 .
Around 1.6250, previous multiple tops were established. That's why a considerable support is expected to be found there.
Near 1.6250 extending down to 1.6200, the lower limit of the ongoing bullish channel comes to meet the pair. Bullish pressure may be expressed on retesting.
On the other hand, breakdown of 1.6200-1.6250 on a daily basis turns the ongoing bullish bias into a bearish one targeting at 1.6140 initially.
NZD/USD
Trading recommendation:
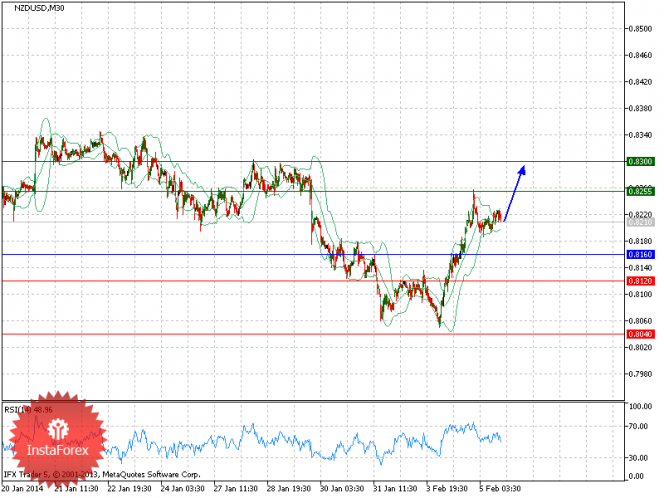
The pair is trading above its pivot point. It is likely to trade in a higher range as far as it remains above its pivot point. As far as the price is above its pivot point, a long position is recommended with the first target at 0.8255 and the second target at 0.83. In an alternative scenario, if the price moves below its pivot points, short positions are recommended with the first target at 0.812. A breach of this target will push the pair further downwards and one may expect the second target at 0.804. The pivot point is at 0.816.
Resistance levels:
0.8255
0.83
0.8345
Support levels:
0.812
0.804
0.798
USD/CAD
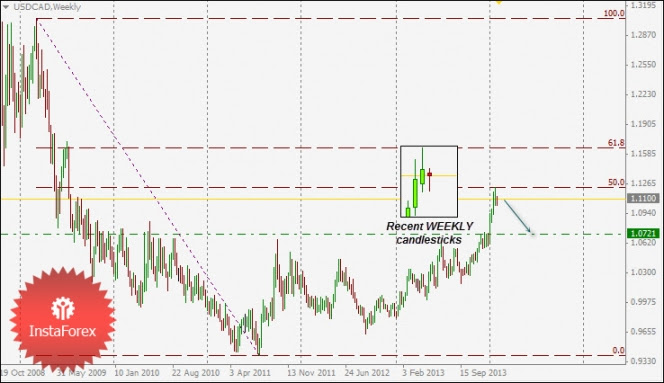
Bulls have managed to hit fresh highs (around 1.1220) since 2009.
Temporarily, USD failed to keep its gains against CAD, and the USD/CAD pair was pushed to the downside, thus indicating weakness of the ongoing bullish momentum. This is manifested in the recent weekly candlestick closures depicted in the chart.
The prominent resistance zone is located around 1.1230-1.1250 corresponding to 50% Fibonacci level of the bearish movement that had been extending since March 2009 and ended in July 2011.
The pair has a significant support zone between 1.0700 and 1.0730 representing the upper limit of consolidation range that got broken last month.
Re-testing of this zone would probably provide a valid BUY entry for the mid-term.
USD/JPY

Overview:
USD/JPY is expected to trade in lower range after hitting two-month low 100.76 Tuesday.It is underpinned by yen-funded carry trades amid improved investor risk sentiment (VIX fear gauge eased 10.87% to 19.11, S&P rose 0.76% overnight) on rise in U.S. ISM-NY current business conditions index to 64.4 in January from 63.8 in December, smaller-than-expected 1.5% drop in U.S. December factory orders (versus minus 1.8% forecast), while emerging-market currencies stabilized against the dollar Tuesday after recent sell-off. USD/JPY is also supported by the demand from Japan importers,rebounding of U.S. Treasury yields. But USD/JPY gains are tempered by Japan exporter sales.
Technical comment:
Daily chart is still negative-biased as MACD and stochastics are bearish, although latter is at oversold zone,5 and 15-day moving averages are declining.
Trading recommendation:
The pair is trading below its pivot point. It is likely to trade in a lower range as far as it remains below its pivot point. A short position is recommended with the first target at 100.7 in mind. A breach of this target would move the pair further downwards to 100.4. The pivot point stands at 101.95. In case the price moves in the opposite direction, bounces back from support, and then moves above its pivot point, it is most favourably expected to move further to the upside. In that scenario, a long position is recommended with the first target at 102.6 and the second target at 102.9.
Resistance levels:
102.6
102.9
103.25
Support levels:
100.7
100.4
100.1
http://www.siamrichest.com/index.php?topic=56.0 

(Forex) วิเคราะห์ค่าเงินทางเทคนิค Forex Technical Analysis
Overview:
USD/CHF is expected to range-trade. It is and supported by the reduced safe-haven appeal of franc as risk aversion recedes. But USD/CHF upside is limited by the franc demand on buoyant CHF/JPY cross. Daily chart is mixed as stochastics is neutral, MACD is in bearish mode, inside-day-range pattern was completed on Tuesday.
Trading recommendation:
The pair is trading above its pivot point. It is likely to trade in a higher range as far as it remains above its pivot point. As far as the price is above its pivot point, a long position is recommended with the first target at 0.908 and the second target at 0.91. In an alternative scenario, if the price moves below its pivot points, short positions are recommended with the first target at 0.898. A breach of this target will push the pair further downwards and one may expect the second target at 0.8955. The pivot point is at 0.9015.
Resistance levels:
0.908
0.91
0.912
Support levels:
0.898
0.8955
0.8925
GBP/JPY
Overview:
GBP/JPY is expected to trade in lower range. It is underpinned by reduced investor risk aversion and demand from Japan importers. But GBP/JPY gains are tempered by the Japan exporter sales. Daily chart is still negative-biased as MACD is bearish; stochastics stays suppressed at oversold zone, 5 and 15-day moving averages are declining.
Trading recommendation:
The pair is trading below its pivot point. It is likely to trade in a lower range as far as it remains below its pivot point. Short position is recommended with the first target at 163.85 in mind. A breach of this target will move the pair further downwards to 162.95. The pivot point stands at 166.9. In case the price moves in the opposite direction, bounces back from support, and then moves above its pivot point, it is most favourably expected to move further to the upside. In that scenario, a long position is recommended with the first target at 168.2 and the second target at 169.7.
Resistance levels:
167.5
168.2
168.9
Support levels:
163.85
162.95
162
GBP/USD
The GBP/USD pair failed to fixate above 1.6600 on January 24. Instead, a strong bearish impulse initiated quickly pushing the pair towards 1.6250 .
Around 1.6250, previous multiple tops were established. That's why a considerable support is expected to be found there.
Near 1.6250 extending down to 1.6200, the lower limit of the ongoing bullish channel comes to meet the pair. Bullish pressure may be expressed on retesting.
On the other hand, breakdown of 1.6200-1.6250 on a daily basis turns the ongoing bullish bias into a bearish one targeting at 1.6140 initially.
NZD/USD
Trading recommendation:
The pair is trading above its pivot point. It is likely to trade in a higher range as far as it remains above its pivot point. As far as the price is above its pivot point, a long position is recommended with the first target at 0.8255 and the second target at 0.83. In an alternative scenario, if the price moves below its pivot points, short positions are recommended with the first target at 0.812. A breach of this target will push the pair further downwards and one may expect the second target at 0.804. The pivot point is at 0.816.
Resistance levels:
0.8255
0.83
0.8345
Support levels:
0.812
0.804
0.798
USD/CAD
Bulls have managed to hit fresh highs (around 1.1220) since 2009.
Temporarily, USD failed to keep its gains against CAD, and the USD/CAD pair was pushed to the downside, thus indicating weakness of the ongoing bullish momentum. This is manifested in the recent weekly candlestick closures depicted in the chart.
The prominent resistance zone is located around 1.1230-1.1250 corresponding to 50% Fibonacci level of the bearish movement that had been extending since March 2009 and ended in July 2011.
The pair has a significant support zone between 1.0700 and 1.0730 representing the upper limit of consolidation range that got broken last month.
Re-testing of this zone would probably provide a valid BUY entry for the mid-term.
USD/JPY
Overview:
USD/JPY is expected to trade in lower range after hitting two-month low 100.76 Tuesday.It is underpinned by yen-funded carry trades amid improved investor risk sentiment (VIX fear gauge eased 10.87% to 19.11, S&P rose 0.76% overnight) on rise in U.S. ISM-NY current business conditions index to 64.4 in January from 63.8 in December, smaller-than-expected 1.5% drop in U.S. December factory orders (versus minus 1.8% forecast), while emerging-market currencies stabilized against the dollar Tuesday after recent sell-off. USD/JPY is also supported by the demand from Japan importers,rebounding of U.S. Treasury yields. But USD/JPY gains are tempered by Japan exporter sales.
Technical comment:
Daily chart is still negative-biased as MACD and stochastics are bearish, although latter is at oversold zone,5 and 15-day moving averages are declining.
Trading recommendation:
The pair is trading below its pivot point. It is likely to trade in a lower range as far as it remains below its pivot point. A short position is recommended with the first target at 100.7 in mind. A breach of this target would move the pair further downwards to 100.4. The pivot point stands at 101.95. In case the price moves in the opposite direction, bounces back from support, and then moves above its pivot point, it is most favourably expected to move further to the upside. In that scenario, a long position is recommended with the first target at 102.6 and the second target at 102.9.
Resistance levels:
102.6
102.9
103.25
Support levels:
100.7
100.4
100.1
http://www.siamrichest.com/index.php?topic=56.0