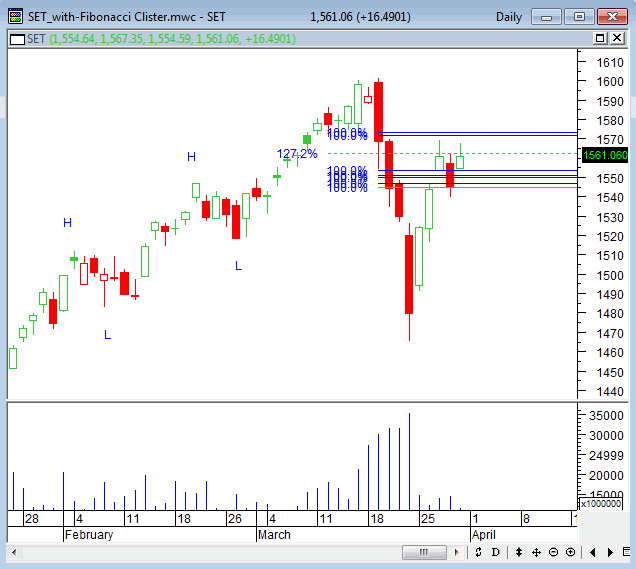
จากรูป ถ้าผิดตกอย่างไร ต้องขออภัยด้วยครับ

และสำหรับการใช้ STRC มาวิเคราะห์รายวัน
ในวันจันทร์ SET น่าจะเทรดอยู่ระหว่าง +10 จุด กับ -12 จุด ... หรืออยู่ระหว่าง 1571.76 จุด กับ 1549.13 จุด
ซึ่งในอาทิตย์หน้า คงเป็นช่วงเวลาของการตัดสินใจที่สำคัญอีกครั้งหนึ่ง ว่าจะซื้อ ถือ หรือขาย
อ้างอิง
http://www.tasimplified.com
เพิ่มเติม
http://www.tradecision.com/product/special_techniques/fibonacci_clusters.htm
Using Fibonacci Clusters you can determine the probability of a trend reversal for each price level. Fibonacci Clusters indicate the price level on which a potential change in the trend may occur. The stronger the cluster, the greater the likelihood that the price level is a support or resistance level for the current trend.
Fibonacci Clusters were not designed to be used alone. They should be used as a confirming technical analysis indicator or to determine where a change in a trend may potentially happen.
Fibonacci Clusters are calculated using the following procedure:
the price range of a security is divided into a specified number of sub-ranges (clusters). After that, Tradecision uses all pivots (minor, intermediate and major) to form all possible Fibonacci Levels (Retracements and Extensions). The more Fibonacci Levels are assigned to a cluster, the stronger the cluster is.
เพิ่มเติม
http://blog.nobletrading.com/2008/07/fibonacci-cluster-technical-indicator.html
Fibonacci cluster is an advanced Fibonacci technical indicator used extensively by traders of all kinds to find support and resistance levels and to predict trend reversals. Fibonacci clusters are easy to interpret and are easy to use in conjunction with other technical analysis tools.


1-2-3 เดย์เทรด [วันหยุด] ... SET Fibonacci Clusters
และสำหรับการใช้ STRC มาวิเคราะห์รายวัน
ในวันจันทร์ SET น่าจะเทรดอยู่ระหว่าง +10 จุด กับ -12 จุด ... หรืออยู่ระหว่าง 1571.76 จุด กับ 1549.13 จุด
ซึ่งในอาทิตย์หน้า คงเป็นช่วงเวลาของการตัดสินใจที่สำคัญอีกครั้งหนึ่ง ว่าจะซื้อ ถือ หรือขาย
อ้างอิง http://www.tasimplified.com
เพิ่มเติม http://www.tradecision.com/product/special_techniques/fibonacci_clusters.htm
Using Fibonacci Clusters you can determine the probability of a trend reversal for each price level. Fibonacci Clusters indicate the price level on which a potential change in the trend may occur. The stronger the cluster, the greater the likelihood that the price level is a support or resistance level for the current trend.
Fibonacci Clusters were not designed to be used alone. They should be used as a confirming technical analysis indicator or to determine where a change in a trend may potentially happen.
Fibonacci Clusters are calculated using the following procedure:
the price range of a security is divided into a specified number of sub-ranges (clusters). After that, Tradecision uses all pivots (minor, intermediate and major) to form all possible Fibonacci Levels (Retracements and Extensions). The more Fibonacci Levels are assigned to a cluster, the stronger the cluster is.
เพิ่มเติม http://blog.nobletrading.com/2008/07/fibonacci-cluster-technical-indicator.html
Fibonacci cluster is an advanced Fibonacci technical indicator used extensively by traders of all kinds to find support and resistance levels and to predict trend reversals. Fibonacci clusters are easy to interpret and are easy to use in conjunction with other technical analysis tools.